
Three races in. One clear leader. A midfield that is closer than the results suggest. And a weight problem which will show it ways into the data.
Before Miami arrives and the first wave of upgrades reshuffles the order, this is the moment to take stock. This piece covers race pace development, tyre degradation, and corner performance, a full picture of where every team actually stands, backed by data rather than vibes. If you have been watching the races but are not quite sure how the teams truly compare to one another or you just need to catch up before Miami, this is the read for you.
The Weight Problem
Before getting into the metrics, there is one structural disadvantage shaping this entire early season that has not received enough attention: car weight.
The 2026 regulations set the minimum weight at 770kg. Teams that come in under that limit use ballast, essentially bolt-on weights – to reach the threshold. The critical advantage is not just meeting the minimum. It is where they place the ballast. Underweight teams can position it precisely to optimize car balance for the driver’s preferences, without touching the setup. That flexibility is significant and largely invisible in the race coverage.
Teams running overweight have none of that. They are slower in every measurable way, harder to brake, slower to accelerate, lower top speed, reduced corner speed, and they have no ballast to reposition. Weight is the kryptonite of a racing car, and right now, eight of eleven teams are carrying too much of it.
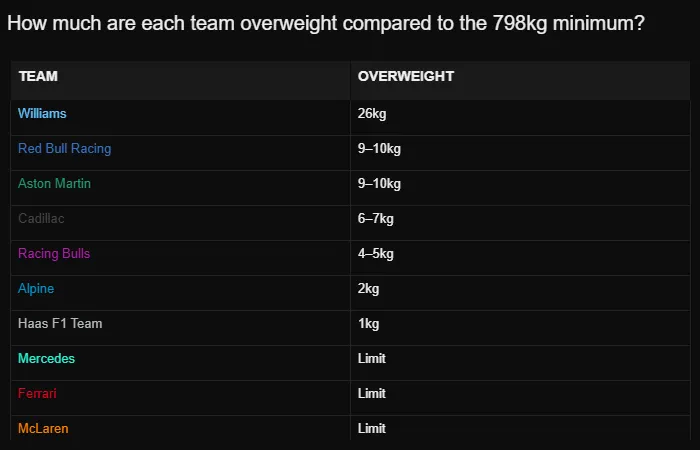
Williams’ figure is the one that stands out. Twenty-six kilograms is not a marginal deficit, it is a fundamental performance handicap that no setup change can paper over.
Between Japan and Miami, teams are attacking this through unconventional means: alternative bolt materials, revised carbon fibre layup combinations, and stripping paint. Every gram counts when you are this far over the line.
This weight table will matter again when you reach the corner performance section. The correlation is not subtle.
Tyre Degradation
Tyre degradation shapes the race strategy as much as raw pace. A car that is gentle on its rubber can stretch stints, force rivals to do an extra stop and win races it has no business winning on pure speed alone. If you have difficulty either over taking or defending, you can undercut or extend with less worries of making it to end. It is so powerful, which is why everyone is talking about it all the time.
The data here is fuel-adjusted laptimes in clean air, on medium and hard compounds only. Race tyres, real conditions, no fighting or qualifying laps skewing the picture. Each team receives a score per race, averages across drivers and compounds. A higher score means better tyre management.
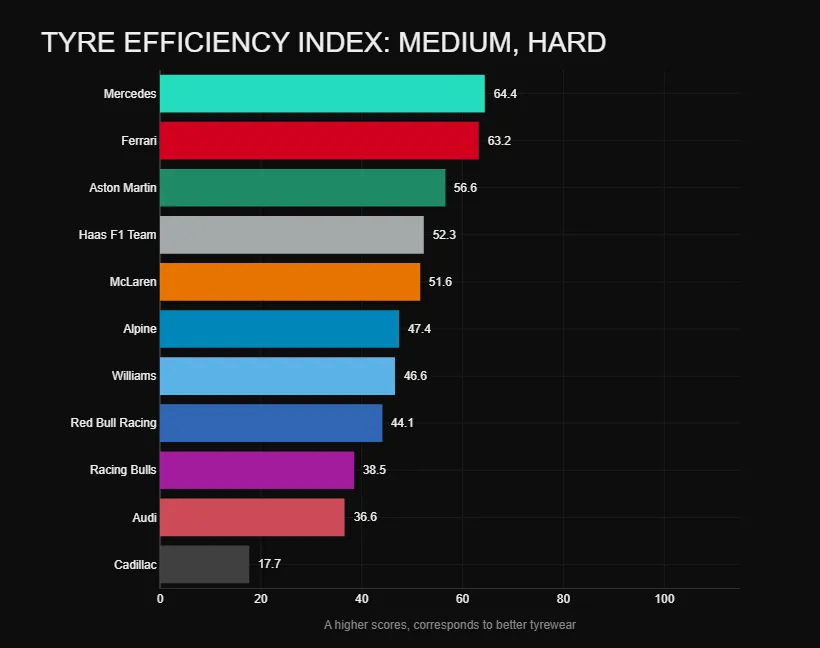
The more interesting story is Ferrari in second at 63.2, almost matching Mercedes. That is not a number you expect to see from a team that has been struggling to close the gap on pure pace. It suggests the Ferrari chassis is genuinely kind to its rubber, and that strategically they have more weapons than the race results have shown so far.
Aston Martin sit third at 56.6, well above where their pace ranking would place them. A slow car with healthy tyres can become a strategic factor even when it has no business being one. That Aston Martin number is worth watching.
McLaren at 51.6 is the chart’s quiet concern. Second on pace, fifth on tyre management. The gap between what McLaren can do over one lap and what they can sustain over a race distance is a problem that upgrades alone will not solve.
The bottom of the chart is where the midfield gets complicated. Red Bull at 44.1, Racing Bulls at 38.5, Audi at 36.6, three teams clustered in a range where tyre management could be the difference between points and nothing. Cadillac sit last at 17.7, a significant gap to everyone above them.
Before reading too much into any individual position, tyre degradation is a relative measure. A slow car can show excellent wear and still be nowhere near a faster car’s lap times. What matters is comparing teams at similar pace levels. Aston Martin’s third place ranking is impressive in isolation, but it does not close the gap to Mercedes on Sunday afternoon.
The clearest data we are missing is a Bahrain-style grinder. Those cancelled Middle East races would have been the perfect stress test , Bahrain is one of the most aggressive tyre circuits on the calendar and would have separated these teams decisively. Miami and Spain should give us something to work with.
Consider this chart a first reading. It will look different in four weeks.
Corner Performance
Corner performance is where car concepts reveal themselves. Slow corners expose mechanical grip, suspension geometry, car balance, and how the chassis loads the tyre. Medium corners are where the aerodynamic downforce starts to dominate. Fast corners are a pure test of aero efficiency and driver commitment at the limit.
The methodology here is deliberately clean: taking qualifying laps, where the car is low fuel, no air and driver going to the limits of the car. Each corner from each track is scored from 1-100 relative to the full grid, then averaged by type across the first three weekends. Think of slow corners as hairpins, mediums as esses and fast corners as R130 in Japan.
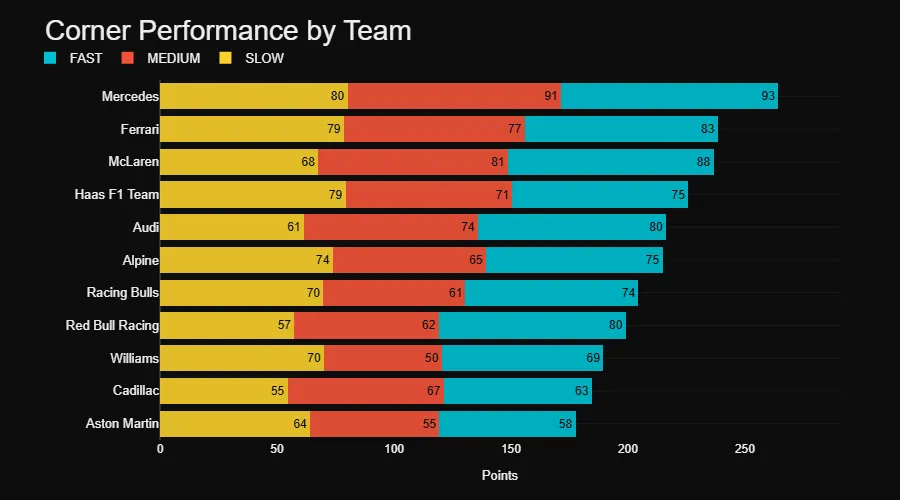
Mercedes are currently not just leading, they are leading in every category. Their slow corner score of 80 is strong, while medium of 91 is dominant and fast corner at 93 is currently untouchable. Much of the attention this season has been on the Mercedes power unit, but the chassis deserves equal credit. They know exactly how good their overall package is – and they should.
Ferrari presents an interesting picture. Their slow corner score of 79 nearly matches Mercedes, the chassis and mechanical grip are genuinely there. But the drop to 77 in medium corners and 83 in fast corners tells you the Ferrari have not been able to convert the mechanical base into aerodynamic performance. The rumours of a supremely aerodynamic Ferrari have not shown up in this data. However from a racing perspective it seems like the car has been built for combat, hard to unsettle in dirty air and difficult to pass in the tight stuff. Mclaren’s profile is almost a mirror image: weak in slow corners and rising in the medium/fast corners. Strong aero platform, limited mechanical grip.
Haas deserves a mention in this part of the analysis. A slow corner score of 79 – matching the Ferrari – from a midfield team is not a number one would expect to see. Their aerodynamic scores are more modest, but the mechanical grip foundation is genuinely impressive relative to their resources. Haas is starting on the front foot this year. However a team who have started on the backfoot is Redbull with the slow corner score of 57, which is currently the most telling number on the chart. Verstappen has been vocal about the car’s instability and poor cornering. The data confirms that it is not just perception.
The chart clearly shows a weight correlation which is worth noting. Strip out Cadillac and Aston Martin, who have other issues compounding their results, and the midfield order on this chart tracks almost exactly with the overweight table from earlier. Haas, Alpine, Racing Bulls, Redbull and Williams. The heavier the car, the lower the corner score. Probably not a coincidence.
One caveat before drawing firm conclusions: this analysis assumes drivers are pushing to the limit of every corner. In 2026, with energy management dictating when and where power is deployed, that assumption is not always valid. Alonso said after Japan that the pit crew could have driven the car in the corners.
For Miami, the FIA have made changes to the harvesting regulations, likely reducing the incentive to lift and coast and pushing drivers to commit fully through corners. If that holds, we will run the same analysis on Miami qualifying data – and it should give us a much cleaner read.
Race Pace
Rather than averaging pace across all three races into a single number, the chart tracks each team race by race. That distinction matters, it separates a genuinely fast car from a team that had one good weekend, and shows who is actually developing versus who is standing still.
The methodology: fuel-adjusted lap times in clean air only. Laps where the car was lighter have been corrected upward to account for the fuel advantage, ensuring DNFs and early retirements are not artificially flattered. The result is the cleanest possible read on true race pace. Gap is expressed as a percentage to the race leader – Mercedes – across all three rounds.
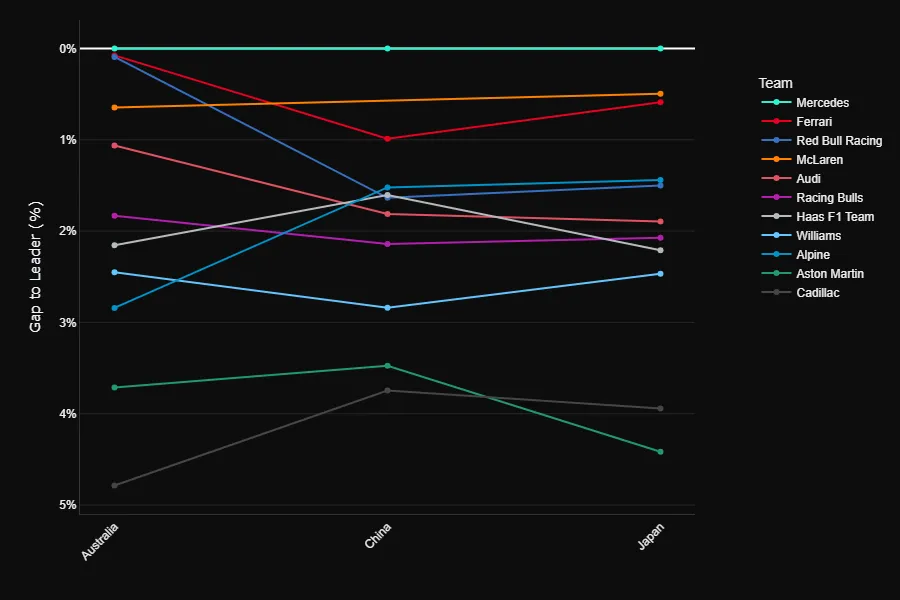
Mercedes sit at 0% across Australia, China and Japan. Flat, immovable, the benchmark everything else is measured against. The energy yoyo effect – where aggressive harvesting disrupts rhythm in traffic, makes it harder for them to pull away in the early laps. But once they reach clean air with full energy efficiency, they slide away from the field with ease. The chart confirms what the race results have been suggesting: no one is close. If there is one thing worth noticing for Mercedes, I am not convinced they fully understand their car. This shows on the basis of Russels performance in Japan.
Ferrari started the season well, sitting around 0.2% off in Australia. By China that gap had grown, and while Japan brought a partial recovery, the trend line is moving in the wrong direction. The chassis is genuinely strong, the corner performance data confirms that, but the Ferrari power unit is conceding too much to Mercedes on the straights, and Miami’s long straight sections will not help. Going into the race weekend, Ferrari have been focused on refining their energy deployment software, which is the right area to target. Whether the gains arrive in time is another question.
McLaren’s line looks dramatic on the chart, close in Australia, no data in China, back to competitive in Japan. The China reading is misleading; Piastri crashed in Australia and neither driver started in China, leaving the dataset thin. Japan is the most representative data point, and it shows McLaren within 1% of Mercedes with genuine race pace. That is a worrying sign for Ferrari. Andrea Stella has confirmed a significant aerodynamic upgrade for Miami , if it delivers, the gap at the front could become a three-way conversation.
Red Bull is the quiet crisis on this chart. Being close to Mercedes in Australia and then back off in China is poor. Between China and Japan no development have been made. Flat is bad when the teams around you are learning. Verstappen has been vocal about instability and poor cornering – the corner performance data backed that up, and the pace chart confirms there is no easy fix coming. Based on the China and Japan data, Red Bull are a midfield team right now. That is not a sentence that felt possible to write six months ago.
Alpine has been one of the more encouraging stories in the midfield. Since Australia they have made clear progress in understanding the car and extracting performance from the power unit. Gasly’s ability to hold off Verstappen in Japan was not a fluke, the pace data supports it. Colapinto’s points finish in China confirmed the car can capitalise when opportunity arrives. They are firmly in the midfield fight.
Haas contributed well in Australia and China through Bearman, but the Japan data is incomplete following his 50G crash and DNF. What is visible suggests they are holding their position in the upper midfield. The team are deliberately not chasing small gains – instead focusing on structural stability and energy mapping consistency using their new Toyota simulator. That is a long-game approach, and the pace chart suggests it is not hurting them yet.
Racing Bulls have scored points in all three races, which tells its own story about consistency. They arrive in Miami as the seventh-fastest team and are bringing upgrades with the explicit aim of leading the midfield fight – potentially threatening Red Bull in the process.
Audi have the pace to be a midfield factor but are losing ground at race starts. Both Hülkenberg and Bortoletto have dropped places off the line in every race, reportedly due to the large turbo struggling to spool under the current energy mapping – an issue Mercedes are also managing. Their race pace once settled is respectable, but the starts are gifting positions they then have to claw back.
Williams are being strangled by weight. The 26kg overweight figure from earlier in this piece is not an abstract number, it shows up directly in their pace deficit. The Mercedes power unit should give them a platform to compete in the midfield, but the weight neutralises it entirely. New floor and revised sidepod panels are coming for Miami, with weight reduction the clear priority.
Aston Martin has the most alarming trajectory on the chart. Starting around 3.5% off in Australia and deteriorating to nearly 4.5% by Japan, moving in the wrong direction while the rest of the field stabilises or improves. Engine issues have been the core problem, with Alonso forced to drive with his hands off the wheel in China due to vibrations before retiring. Japan showed marginal progress after the team reduced power output to manage the vibrations. Getting more power with less vibration is the stated goal for Miami. The gap suggests they are running out of time to find it.
Cadillac arrive in Miami on home soil with modest expectations, but they are the one backmarker showing a positive trend. The gap to Mercedes is still around 4%, but the direction of travel is better than Aston Martin’s. Progress is progress.
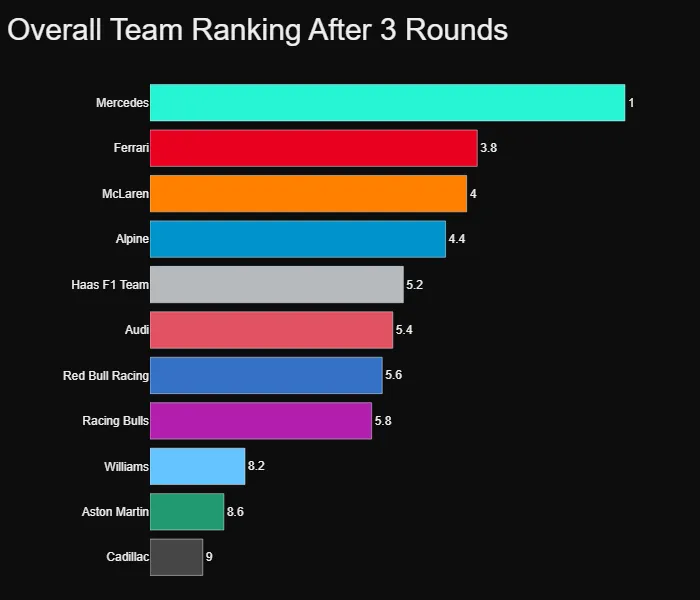
Verdict going into Miami
Mercedes lead every metric. No other team wins a single category. That is the current headline.
Ferrari and McLaren are fast but fragile on tyres, a vulnerability that will matter at some circuits more than others. Red Bull are searching for an identity. Haas are quietly overachieving. And the midfield is close enough that Miami upgrades could redraw the entire order below the top three.
Come back after Miami. The data will look different.
If you have any suggestions or feedback, please use the contact form. Every single word of feedback is appreciated!
Pingback: F1 2026 Miami Development Race: Who Really Won? - LAPTIME