
Engines have been the big talking point of the season, and probably for good reasons. In this piece we look at one slice of them: F1 2026 acceleration, or how hard each car pulls when the driver is flat out.
This year the power unit is roughly 50 % internal combustion engine (ICE) and 50 % electric energy. That has pushed every team to the limit, with completely new engines and far more software to manage. We have seen the issues from the start: yo-yo racing, drivers lifting through fast corners to recharge, drivers losing the feeling of the car, and software failures in the rain.
On the other side, the new engines have turned energy management into a strategic game of chess between teams and drivers. They are also part of the transition to new energy, which has brought bigger manufacturers into F1.
To measure acceleration, we use telemetry from 15 dry qualifying sessions and only look at the moments when the driver is flat out. It is one slice of the engine story, but at some circuits it is the slice that sets lap times apart.
How is it measured?
The idea is simple. We only look at the parts of a lap where the throttle is at 99 % or more, so the driver is taken out of the equation. Then we time how long each car needs to go from one speed to the next, in steps of 20 km/h, on every qualifying lap within 2 % of the driver’s best.
Raw numbers can’t be compared across the tracks, furthermore gearing, air density and how much energy a lap lets you harvest all move the curves of acceleration. So for each round we compare every car to the field median of the same session and then the median across the 15 dry rounds. I have left our Canada and Zandvoort, because they either had rain or damp tracks. We then turn the percentages into time: how many seconds does each car gain or lose going from 160 to 280 km/h, compared to the field?
One honest warning before the charts. Acceleration is power minus drag. A car with a low-drag package will look better here without having a stronger engine. That is exactly why grouping by engine is useful: four different Mercedes chassis that all land in the same place point to the thing they share.
Grouped by engine, the order is clear
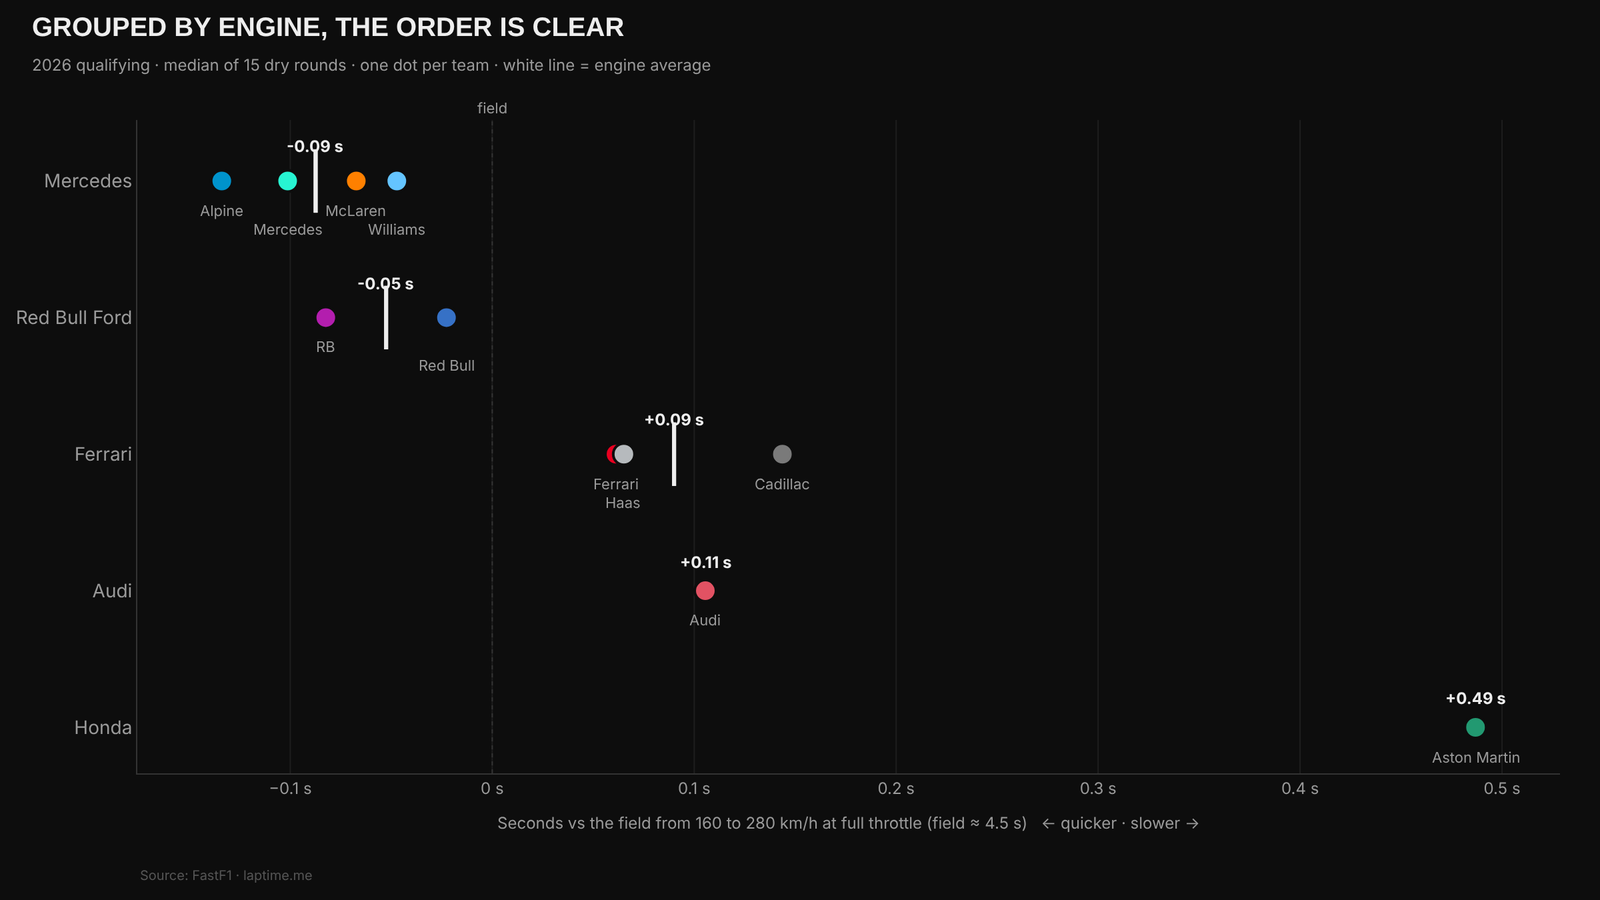
The Mercedes customers sit together on the left, between 0.05 and 0.13 seconds quicker than the field. Alpine is actually the quickest of them all, ahead of the works Mercedes team. The two Red Bull Ford teams are next, Racing Bulls a little ahead of Red Bull.
Then there is a gap. Ferrari and Haas are almost identical at around +0.06 seconds, and Cadillac is the slowest Ferrari-powered car at +0.14. That is the part I find most convincing: four different cars with one engine on the left, three different cars with another engine on the right, and no overlap. The Mercedes group was ahead of the Ferrari group in all 15 dry rounds.
The gap between the two groups is about 0.18 seconds. The spread inside each group is about half that. Put simply, on these numbers the engine matters roughly twice as much as the car around it when you put your foot down.
Audi lands just behind the Ferrari group. And then there is Aston Martin, almost half a second slower than the field every time it accelerates from 160 to 280 km/h. On a track with several long straights, that adds up quickly.
Grouped by engine, the order is clear
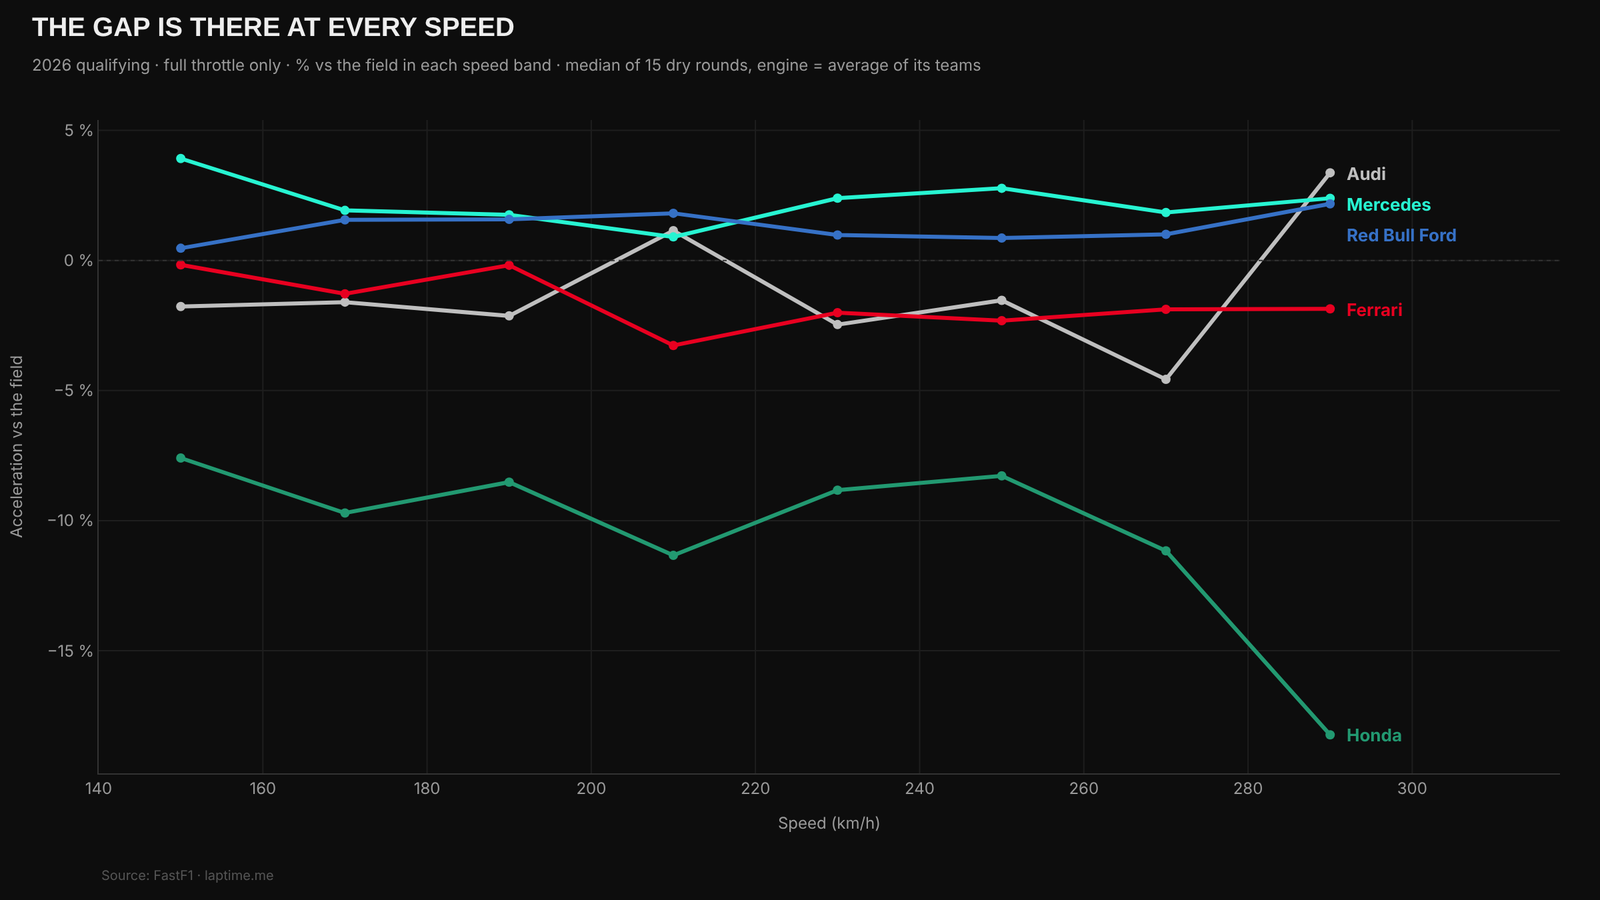
You might expect one engine to be strong at low speed and another at the top end. That is not what the data shows. Mercedes sits 1 to 4 % above the field almost the whole way, Red Bull Ford up to 2 % above, and Ferrari 0 to 3 % below. It is a steady gap, not a weak spot.
Aston Martin is 8 to 11 % down up to 270 km/h and falls to 18 % down in the last band, 280 to 300 km/h. That last drop could be the engine running out of electrical energy earlier than the others, but it could also be drag. From this data alone I can’t separate the two.
The Audi line jumping around is a good reminder of the limits here: it is one team, so a single odd session moves it a lot. Read Audi and Honda as “that car with that engine”, not as a verdict on the engine itself.
The Honda engine is behind, all the way. When the speed reaches 280 km/h the acceleration drops a lot behind the other teams. This is probably why we see the other cars overtake Aston Martin way before the end of the straights.
Baku: same speed, twice the push
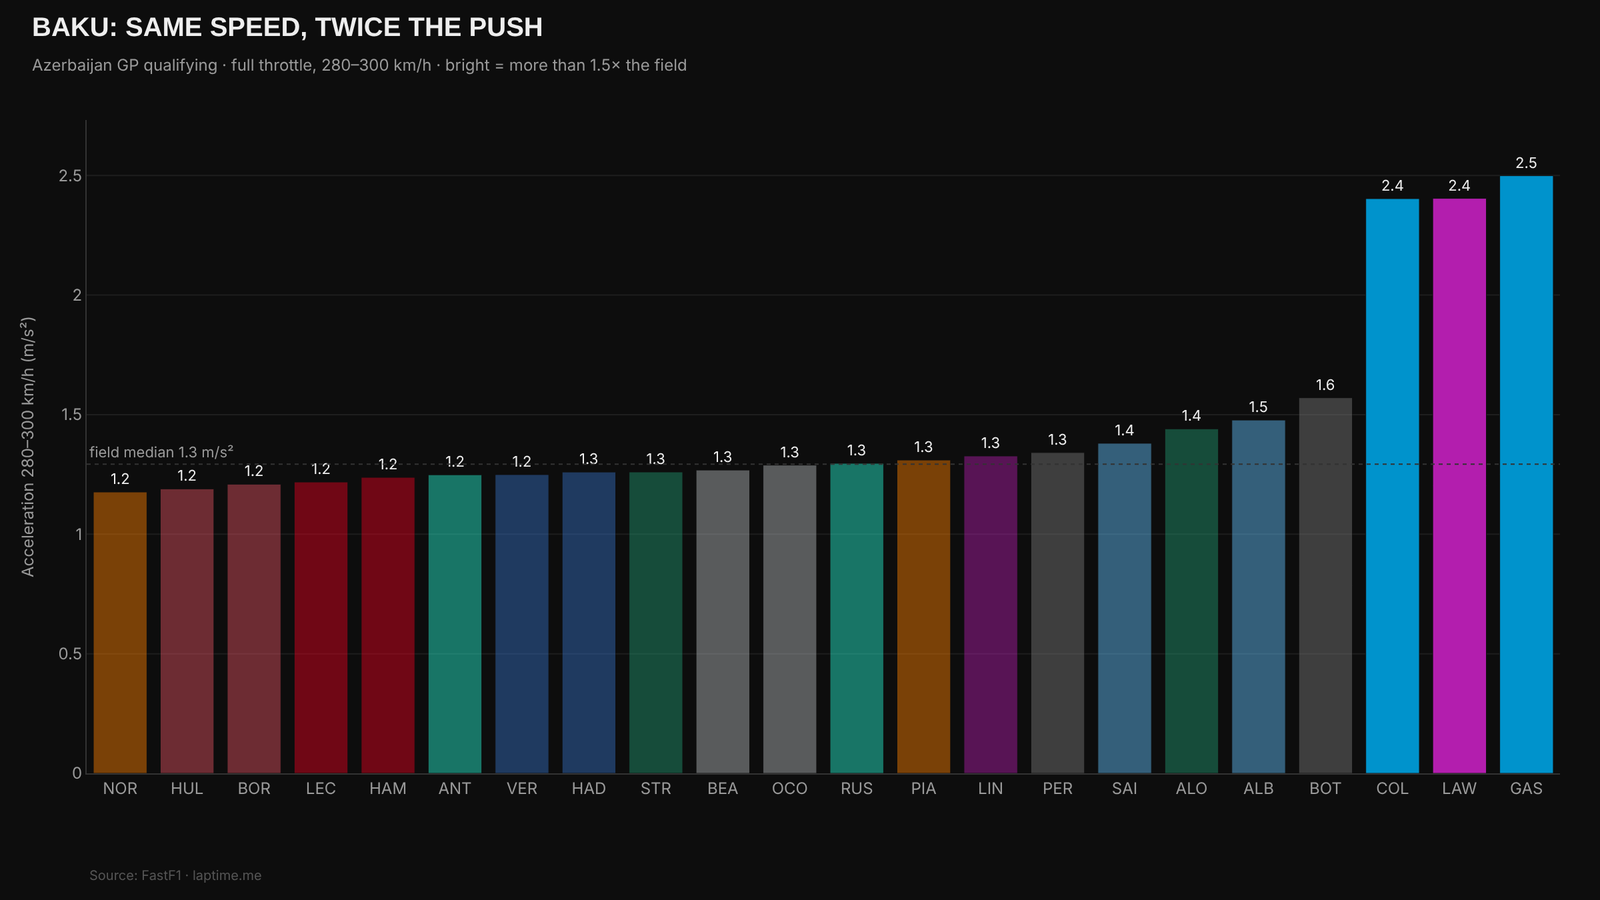
This is why we use the median across rounds and not the average. In Baku, Gasly, Colapinto and Lawson pulled about 2.4 to 2.5 m/s² between 280 and 300 km/h. The rest of the field did around 1.3 m/s². That is almost double.
I don’t think that is the car. Alpine has a Mercedes engine and Racing Bulls a Red Bull Ford, yet the works Mercedes and Red Bull did not do the same. My best guess is energy deployment: those three still had electrical power to spend at the end of the long straight, where everyone else had already started to cut it.
It shows how much of 2026 is about how you use the battery, not only how big the engine is. It also means one session can fool you. Teammates in the same car only agreed clearly in 7 of the 17 sessions. Over a whole season, the picture gets a lot sharper.
Conclusion
Mercedes: The best package when the throttle is open. All four teams are quicker than the field, and none of them sits outside the group. If you have a Mercedes engine in 2026, you start from the right place, when the throttle is open between 160 and 280 km/h.
Red Bull Ford: Just behind Mercedes, and clearly ahead of Ferrari. For a brand new engine project, that is a strong first season.
Ferrari: The three Ferrari-powered cars are 0.06 to 0.14 seconds slower than the field on every 160 to 280 km/h run. Not a disaster, but in qualifying that is time Leclerc and Hamilton have to find in the corners.
Audi and Honda: One team each, so I can’t separate engine from car. Audi is close to Ferrari. Aston Martin is losing almost half a second every time it accelerates through that speed range, and that is the clearest result in the whole data set.
What I am not saying: that this is pure engine power. Drag and how each team chooses to spend its electrical energy are in these numbers too. But when four different cars with one engine all beat three different cars with another over a season, and the group comes out ahead in every single dry round, the engine is the obvious common factor.
If you made it this far and liked the content, sign up for the newsletter. Join me, one lap at a time